As a society, our excitement about traveling abroad has risen since the COVID-19 pandemic. While we have the convenience of our smart devices to track flights, we still revert to using the arrivals and departures board, an integral feature at any airport, for monitoring the in and out-flow of flights.
Let's say, as a traveler, you want to know which airlines are consistently arriving and departing exactly on time and which ones are not. On top of this, you want to know how often airlines are overbooking, where you potentially miss out on a seat, or how frequently they underbook, resulting in airlines moving flights around to fill up flights. To understand this, we must take all the historical data of airline arrivals and departures and turn it into something measurable and interpretable.
For an enterprise's supply chain, it's crucial to understand how well products are being delivered on time and in the correct quantity. For a traveler, a delayed flight can cause major disruption to their holiday plans. This is equally important for an enterprise or company; when products are delivered late, this can impact the production plan. Listed below are some of the flow-on effects on an enterprise, to name a few:
• Staff having to work overtime.
• Customer orders are not being fulfilled and sent out on time
• Congestion at the plant is creating difficulty for drivers to get in and out.
A key reporting tool for an enterprise to track these behaviors is a DIFOT report. DIFOT tracks the number of orders delivered on time with the right quantity on any given day.
DIFOT (delivery in full on time) is a key performance indicator that defines an enterprise's supply chain efficiency in the transport industry. It is generally expressed as the performance of total work being delivered on time and how much of the expected quantity has been delivered.
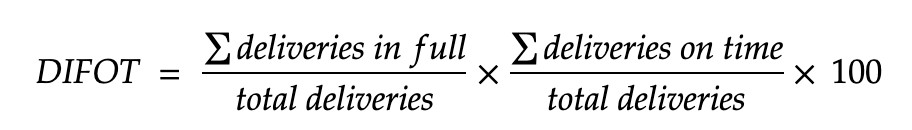
DIFOT is calculated as the following:
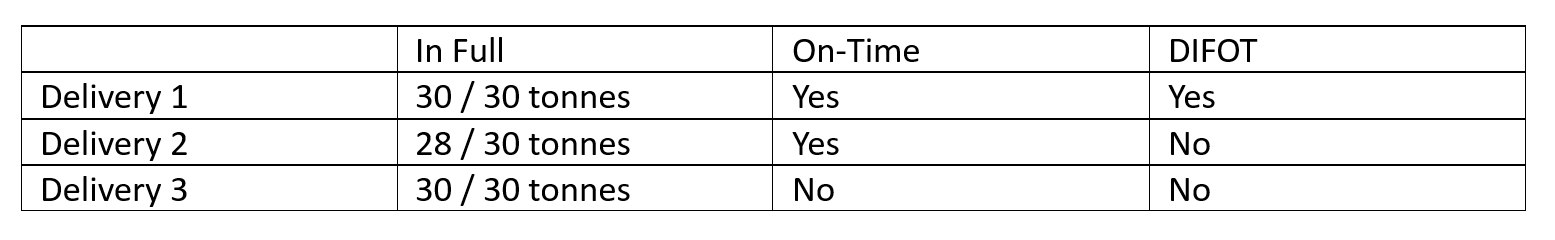
Total DIFOT: 33%
The limitation of this single number is that it provides very little insight. How do we know if 33% is good or bad? Is the business's DIFOT improving from last year or getting worse? Hence, there is a need for DIFOT to be presented and analyzed using data analytics to understand an enterprise's DIFOT performance better.
Historically, DIFOT has been managed through many complex spreadsheets or even pen and paper to track a business's supply chain activities. DIFOT can be presented in a visual form through a data analytics dashboard. An enterprise will be able to use this dashboard to measure its supply chain efficiency per branch, carrier, and product type. These tools enable management to make better decisions that can improve supply chain efficiency. Data can be turned into something measurable and interpretable while understanding the historical trends and behavior in certain areas of the enterprise.
An enterprise will be able to identify if there is a pattern to DIFOT. This can be from a single isolated event due to human error; however, if two or more delivery issues arise from the same carrier, this may be a systemic problem that needs resolving. The causation of these patterns may be:
• Poor carrier behaviour
• Poor access to the plant
• Congestion at the plant
• Overbooking quantities by agents
• Setting unrealistic times for drivers to arrive at the plant.
In today's world, management relies heavily on data analytics to help address these concerns before they become issues. This embedded in a TMS centralizes all the important information about an enterprise's supply chain so that management can make improvements instantly.
The Future of DIFOT Reporting

As mentioned above, DIFOT has improved immensely using data analytics. Below is what we expect to be the future of DIFOT:
• Automatic receipting of goods. This is where products are counted automatically, reducing human error and improving data quality for DIFOT reporting.
• System integration between carriers and enterprises to feed live data from the driver so the warehouse or plant knows exactly when and what will arrive on the day. This makes DIFOT reporting dynamic and up-to-date and better reflects the enterprise's supply chain efficiencies, as DIFOT can be calculated based on specific time windows during the day. Some enterprises require the delivery of certain products to align with their production plan. For instance, in livestock plants, different animals may be processed at different times of the day.
• The use of predictive and prescriptive analytics to understand common trends and what may occur in the future. An enterprise can use this form of analytics to be proactive instead of reactive and prevent any predicament to its DIFOT performance.